

See what's happening right now
The Real-time report is your store’s pulse — who’s on it this moment, what they’re doing, and where they came from. Open Analytics in the left sidebar, then select the Real-time tab. Unlike the other reports, this one has no date range: it’s always now.
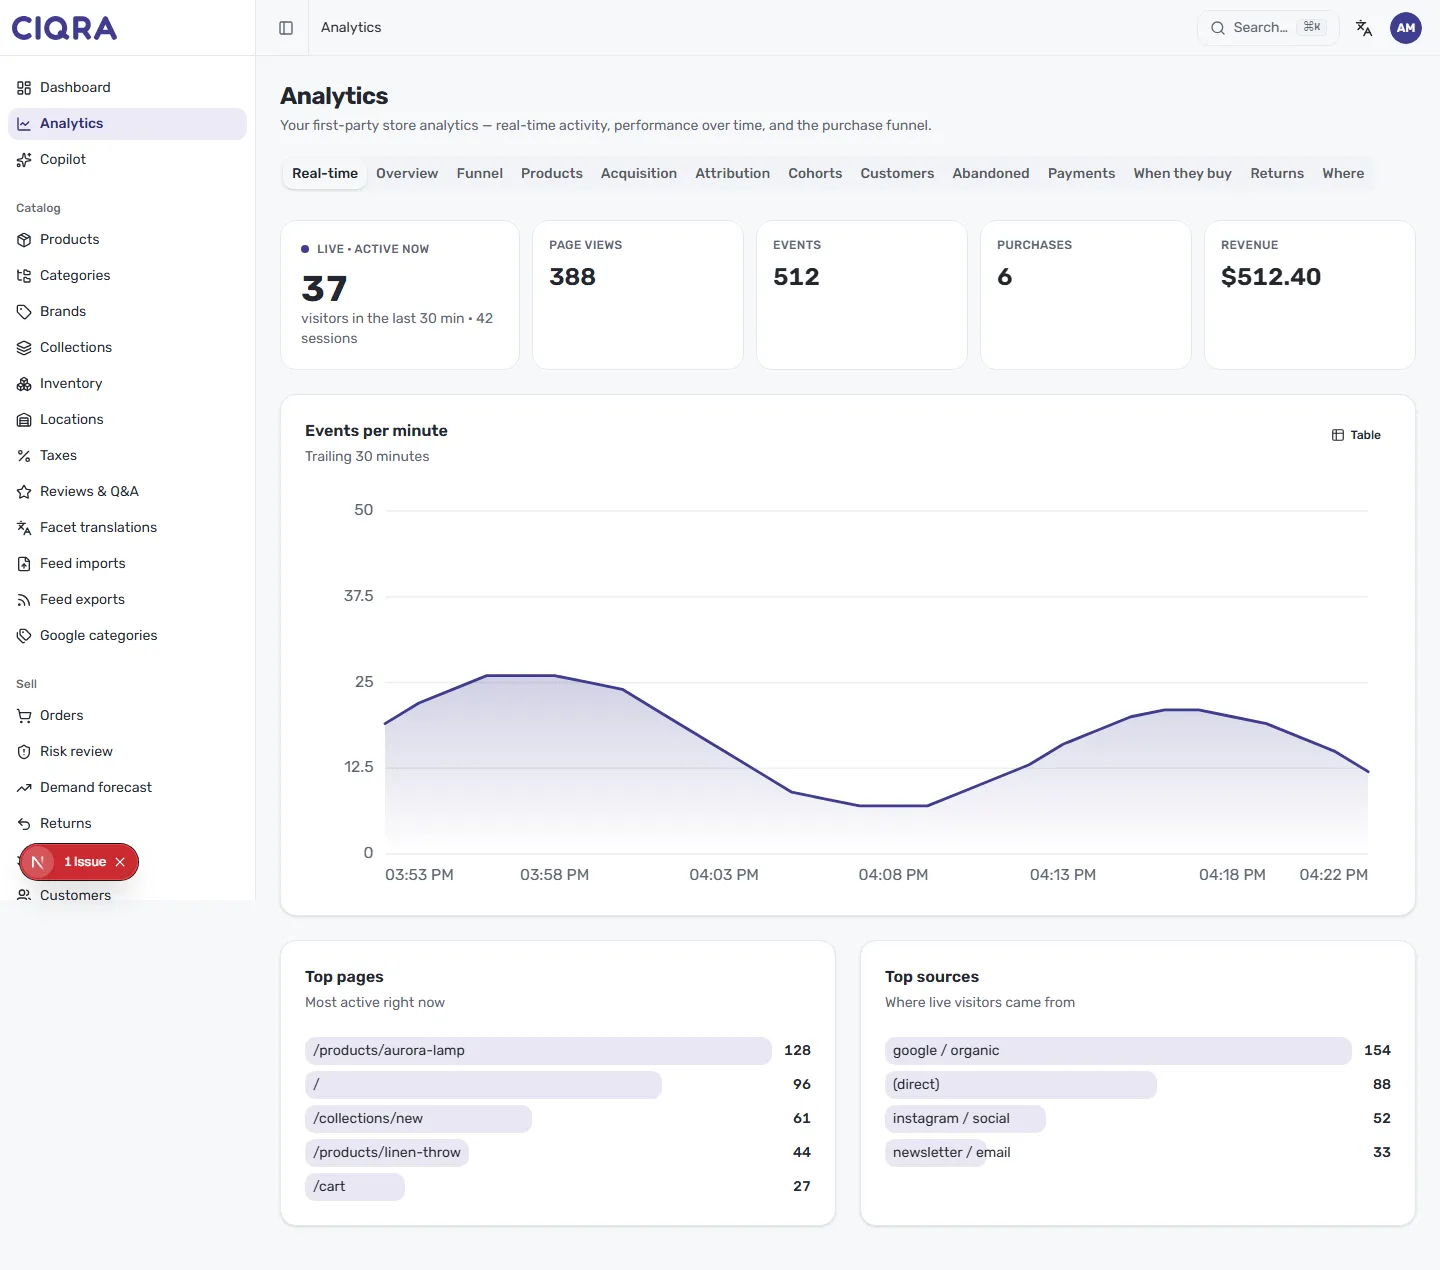
The live counters
Section titled “The live counters”A LIVE · ACTIVE NOW card leads the row, showing how many visitors are on your store right now, with a supporting line such as visitors in the last 30 min · sessions. Alongside it, four more cards track the recent window:
- Page views — pages loaded.
- Events — tracked actions (views, add-to-cart, purchases and the like).
- Purchases — orders placed.
- Revenue — sales value, in your store’s currency.
Together they tell you whether a moment of traffic is turning into real activity.
Events per minute
Section titled “Events per minute”The Events per minute chart plots activity over a trailing 30-minute window, so you can watch spikes and lulls as they happen — a great companion when you launch a campaign, send an email, or post to social and want to see the response land in real time. Select Table to read the exact per-minute figures.
Top pages and top sources
Section titled “Top pages and top sources”Two lists sit below the chart:
- Top pages — the pages drawing the most activity right now, each with a live count. This is where you’ll see a product page climb the moment it gets attention.
- Top sources — where your live visitors came from, such as google / organic, (direct), instagram / social or newsletter / email, each with a count.
When to reach for Realtime
Section titled “When to reach for Realtime”Realtime is for the moment — verifying a launch, watching a promotion, or confirming tracking works. For trends and totals over a chosen period, use the Overview and the other reports instead.