

Find where shoppers drop off
The Funnel report shows the path from browsing to buying — and, more usefully, where people leave it. Open Analytics in the left sidebar, select the Funnel tab, and pick a date range at the top right. It’s the single best view for finding the one step that’s costing you the most sales.
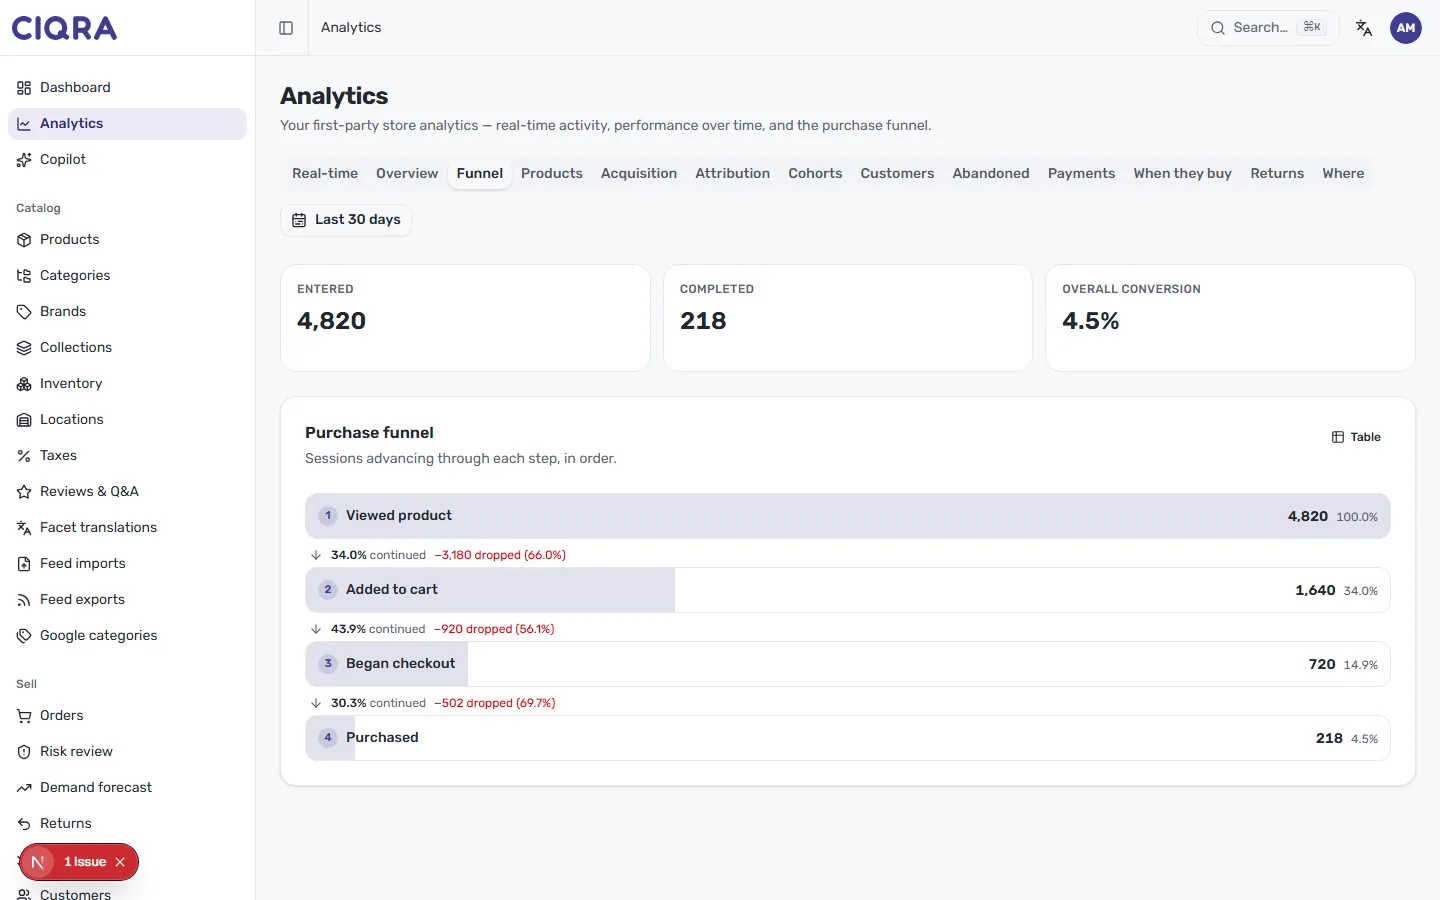
The summary cards
Section titled “The summary cards”Three cards set the scene for your chosen range:
- Entered — sessions that started the funnel.
- Completed — sessions that reached a purchase.
- Overall conversion — the share of entered sessions that completed.
The purchase funnel
Section titled “The purchase funnel”Below the cards, Purchase funnel lays out the steps in order, each as a bar whose width reflects the share of sessions still in play. The steps are:
- Viewed product — the entry point, at 100%.
- Added to cart
- Began checkout
- Purchased
Each bar shows the count and the percentage of the original entrants who reached it — so you can see, for example, how many of the sessions that viewed a product went on to add to cart.
Read the drop-off between steps
Section titled “Read the drop-off between steps”The real insight lives between the bars. Each gap is labelled with how many sessions continued and how many dropped, as both a count and a percentage — for instance, a step might show a share that continued alongside a red dropped figure. Scan down the column and the biggest red number is your biggest opportunity: fix that one step and every step after it benefits.
Read it as a table
Section titled “Read it as a table”Select Table in the top right of the funnel to switch from the bars to exact figures for each step and transition — handy for tracking the same numbers over time.
Turn drop-off into action
Section titled “Turn drop-off into action”The funnel tells you where people leave; pair it with the abandoned-cart view to act on the sessions that got closest to buying. See Every report, at a glance for how the reports fit together.