

Customer value and segments
Not all customers are worth the same, and the Customers report helps you tell them apart — by lifetime value and by how recently and often they buy. Open Analytics in the left sidebar and select the Customers tab.
The summary cards
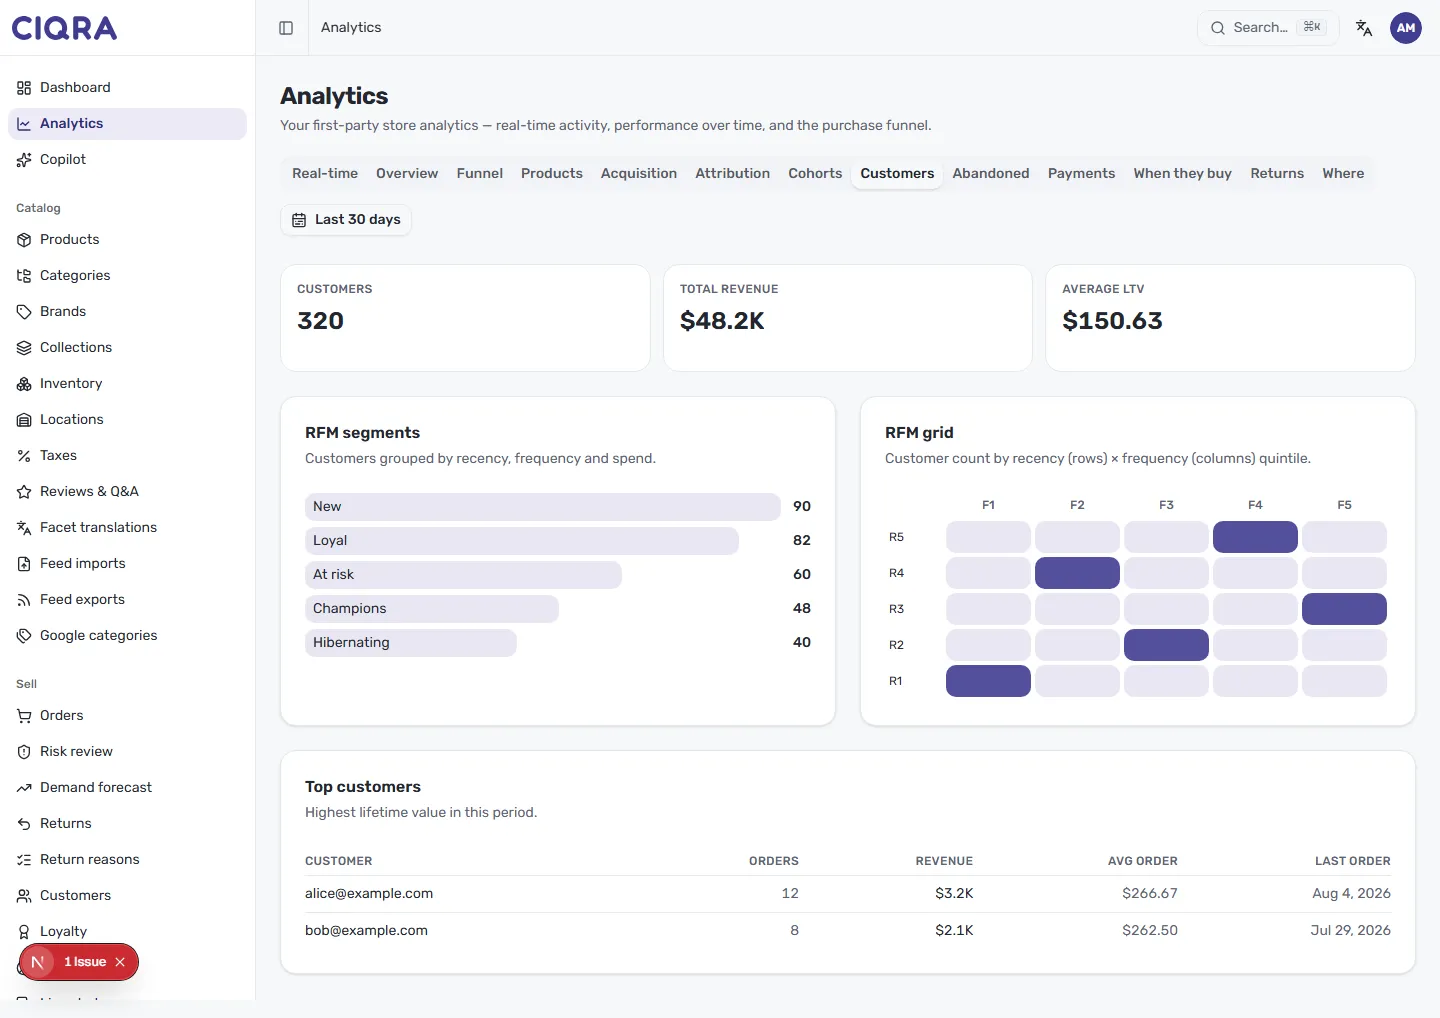
Section titled “The summary cards”Three cards set the top line for your range:
- Customers — how many customers are included.
- Total revenue — their combined revenue, in your store’s currency.
- Average LTV — average lifetime value per customer.
RFM segments
Section titled “RFM segments”The RFM segments panel groups customers by recency, frequency and spend — the three signals behind RFM. Each segment appears as a labelled bar with a count, so you can see the size of each group at a glance. The segments shown include:
- New
- Loyal
- At risk
- Champions
- Hibernating
These names describe where a customer stands: Champions buy often and recently, At risk haven’t been back in a while, and so on.
The RFM grid
Section titled “The RFM grid”Beside the segments, the RFM grid plots customer count by recency (rows) × frequency (columns) quintile. Rows run R1–R5 (recency) and columns run F1–F5 (frequency). Each cell is shaded by how many customers fall into that recency-and- frequency combination, with darker cells holding more customers. It’s a compact map of where your customer base concentrates — top-right cells are your most recent, most frequent buyers.
Top customers
Section titled “Top customers”At the bottom, the Top customers table lists your highest lifetime value customers for the period. Its columns are:
- Customer — the customer’s email.
- Orders — how many orders they’ve placed.
- Revenue — what they’ve spent, in your store’s currency.
- Avg order — their average order value.
- Last order — the date they most recently bought.